DeGAUSS PEPR Guide

This is an example of the workflow a PEPR study site might use to add geomarkers to their data with DeGAUSS.
If you have used DeGAUSS, would you mind providing us some feedback and completing a short survey?
In steps 2 through 6:
- A DeGAUSS container is used to add geomarker(s) to the input file (columns added in each step are highlighted in gray).
- The input file is the CSV created in the previous step, and the output file will be the input in the next step.
Step 0: Install Docker
See Installing Docker.
Note about Docker Settings:
After installing Docker, but before running containers, go to Docker Settings > Advanced and change memory to greater than 4000 MB (or 4 GiB)
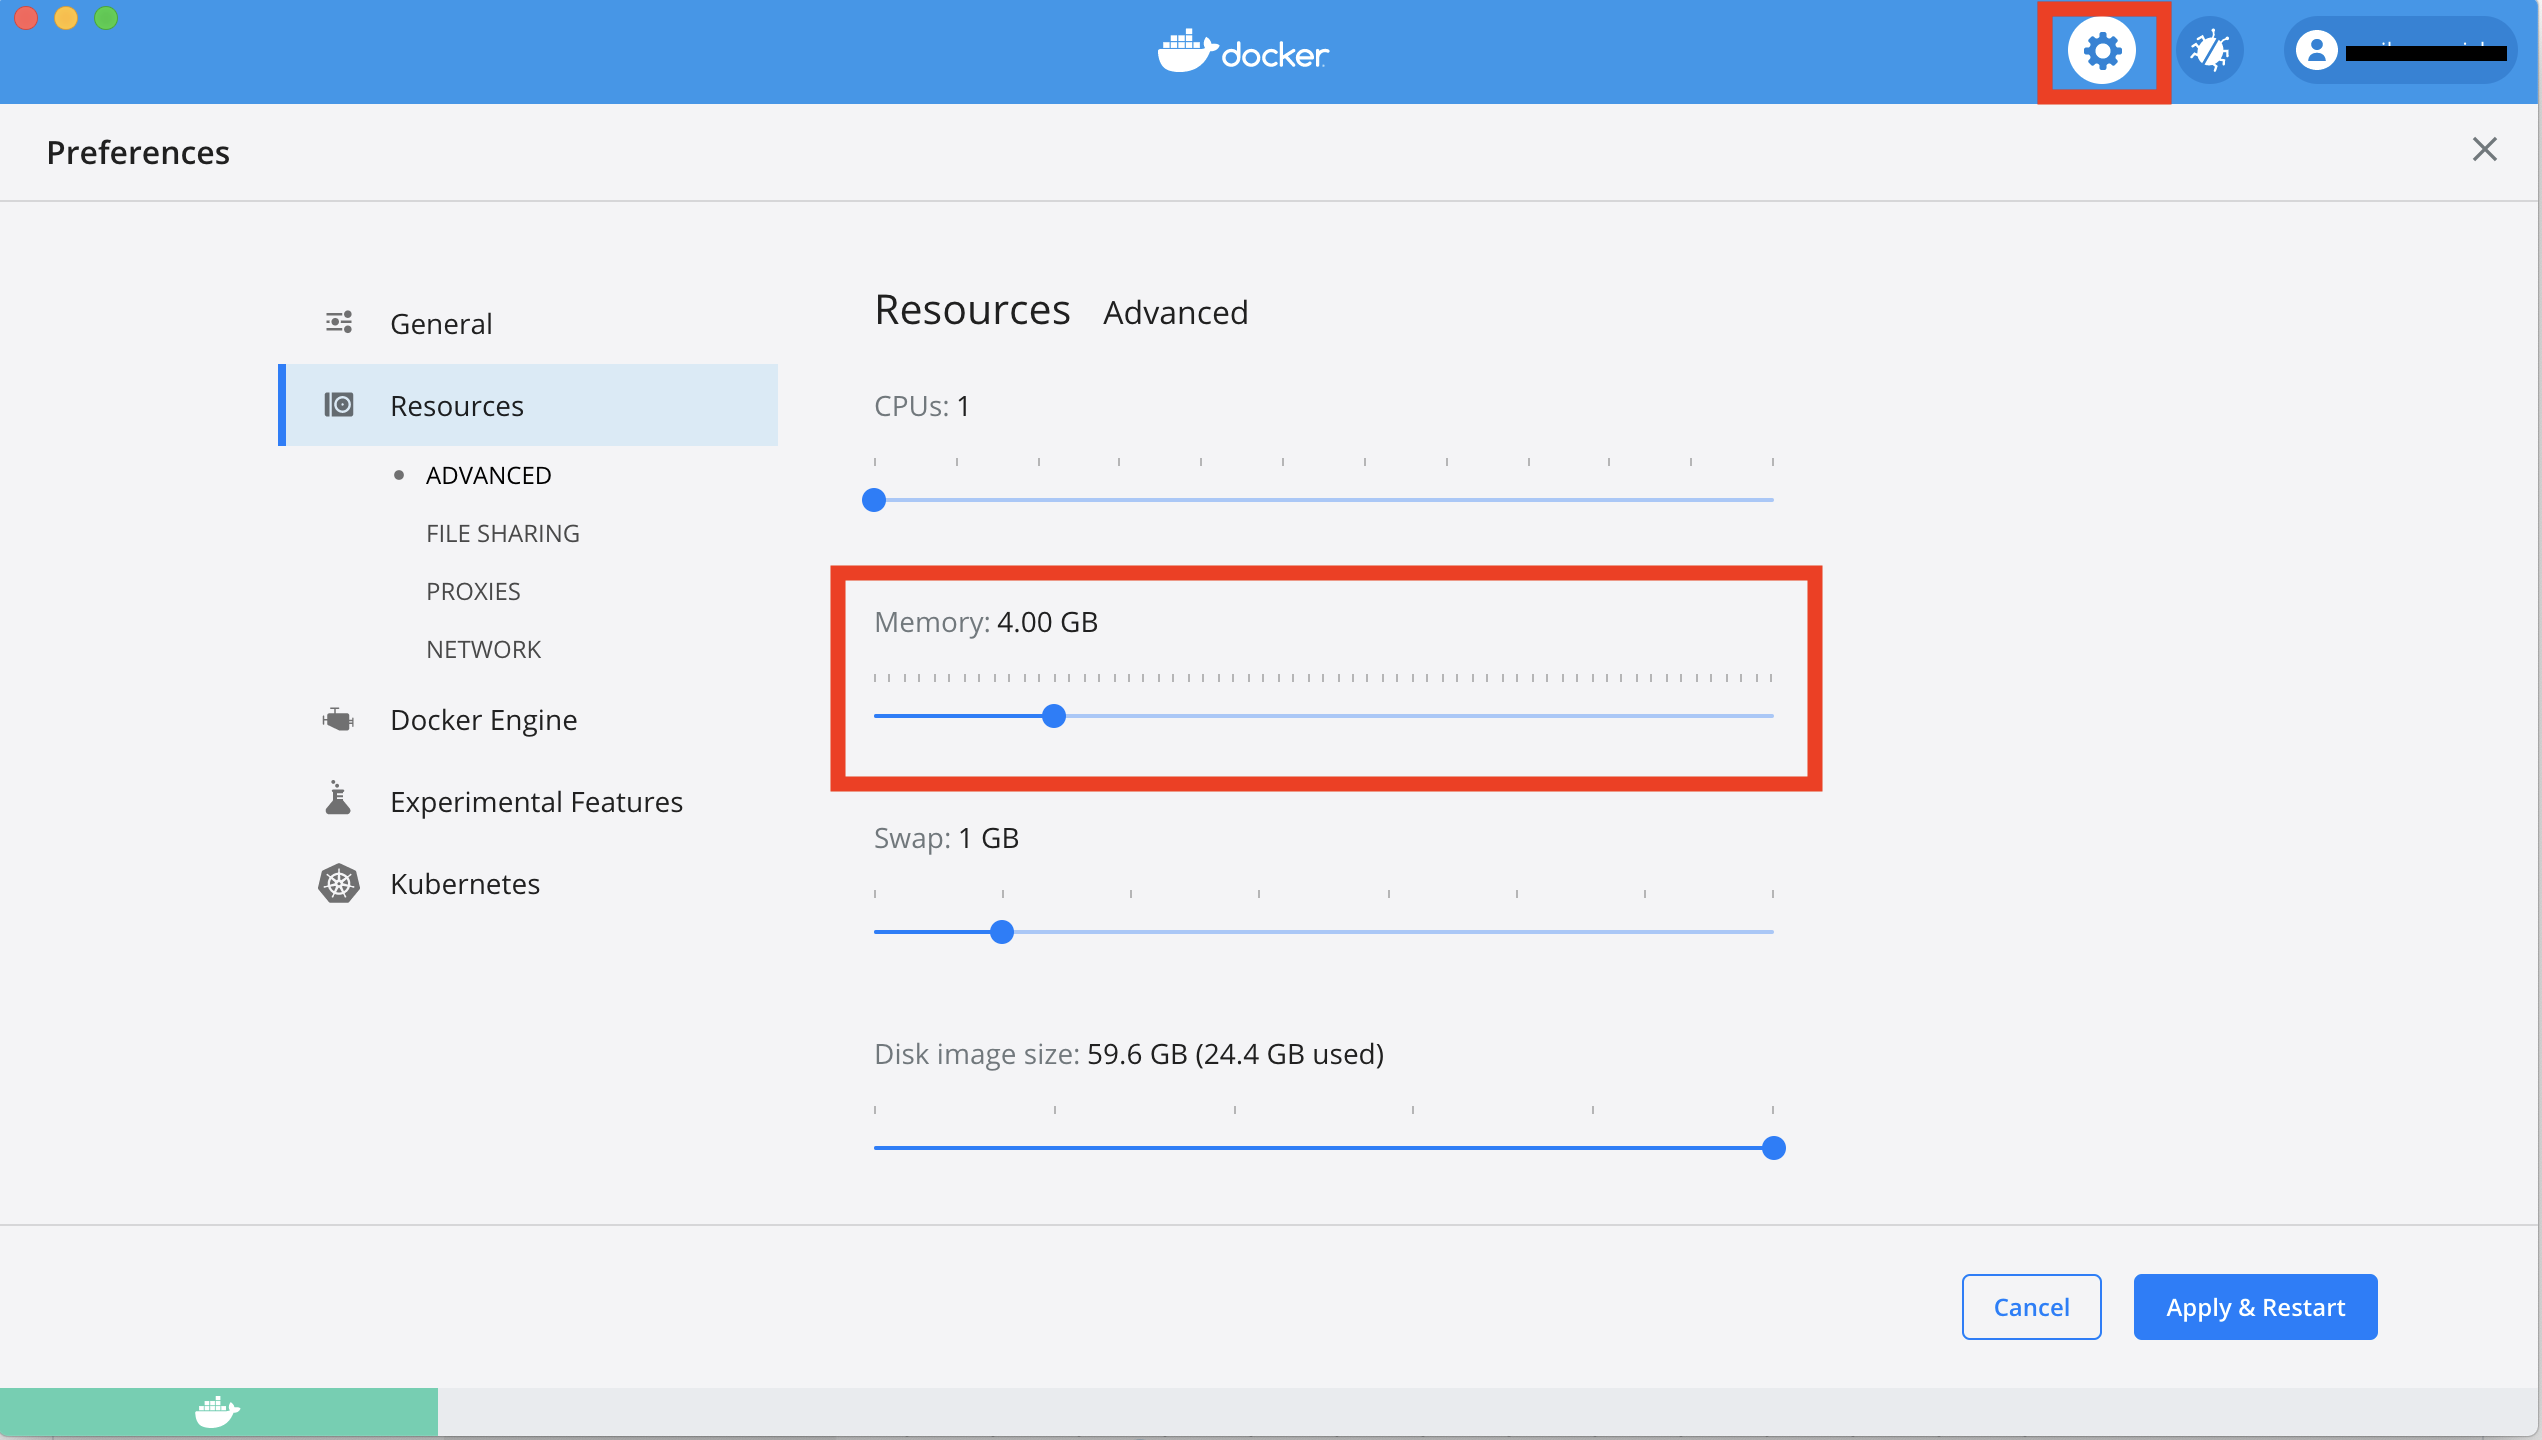
If you are using a Windows computer, also set CPUs to 1.
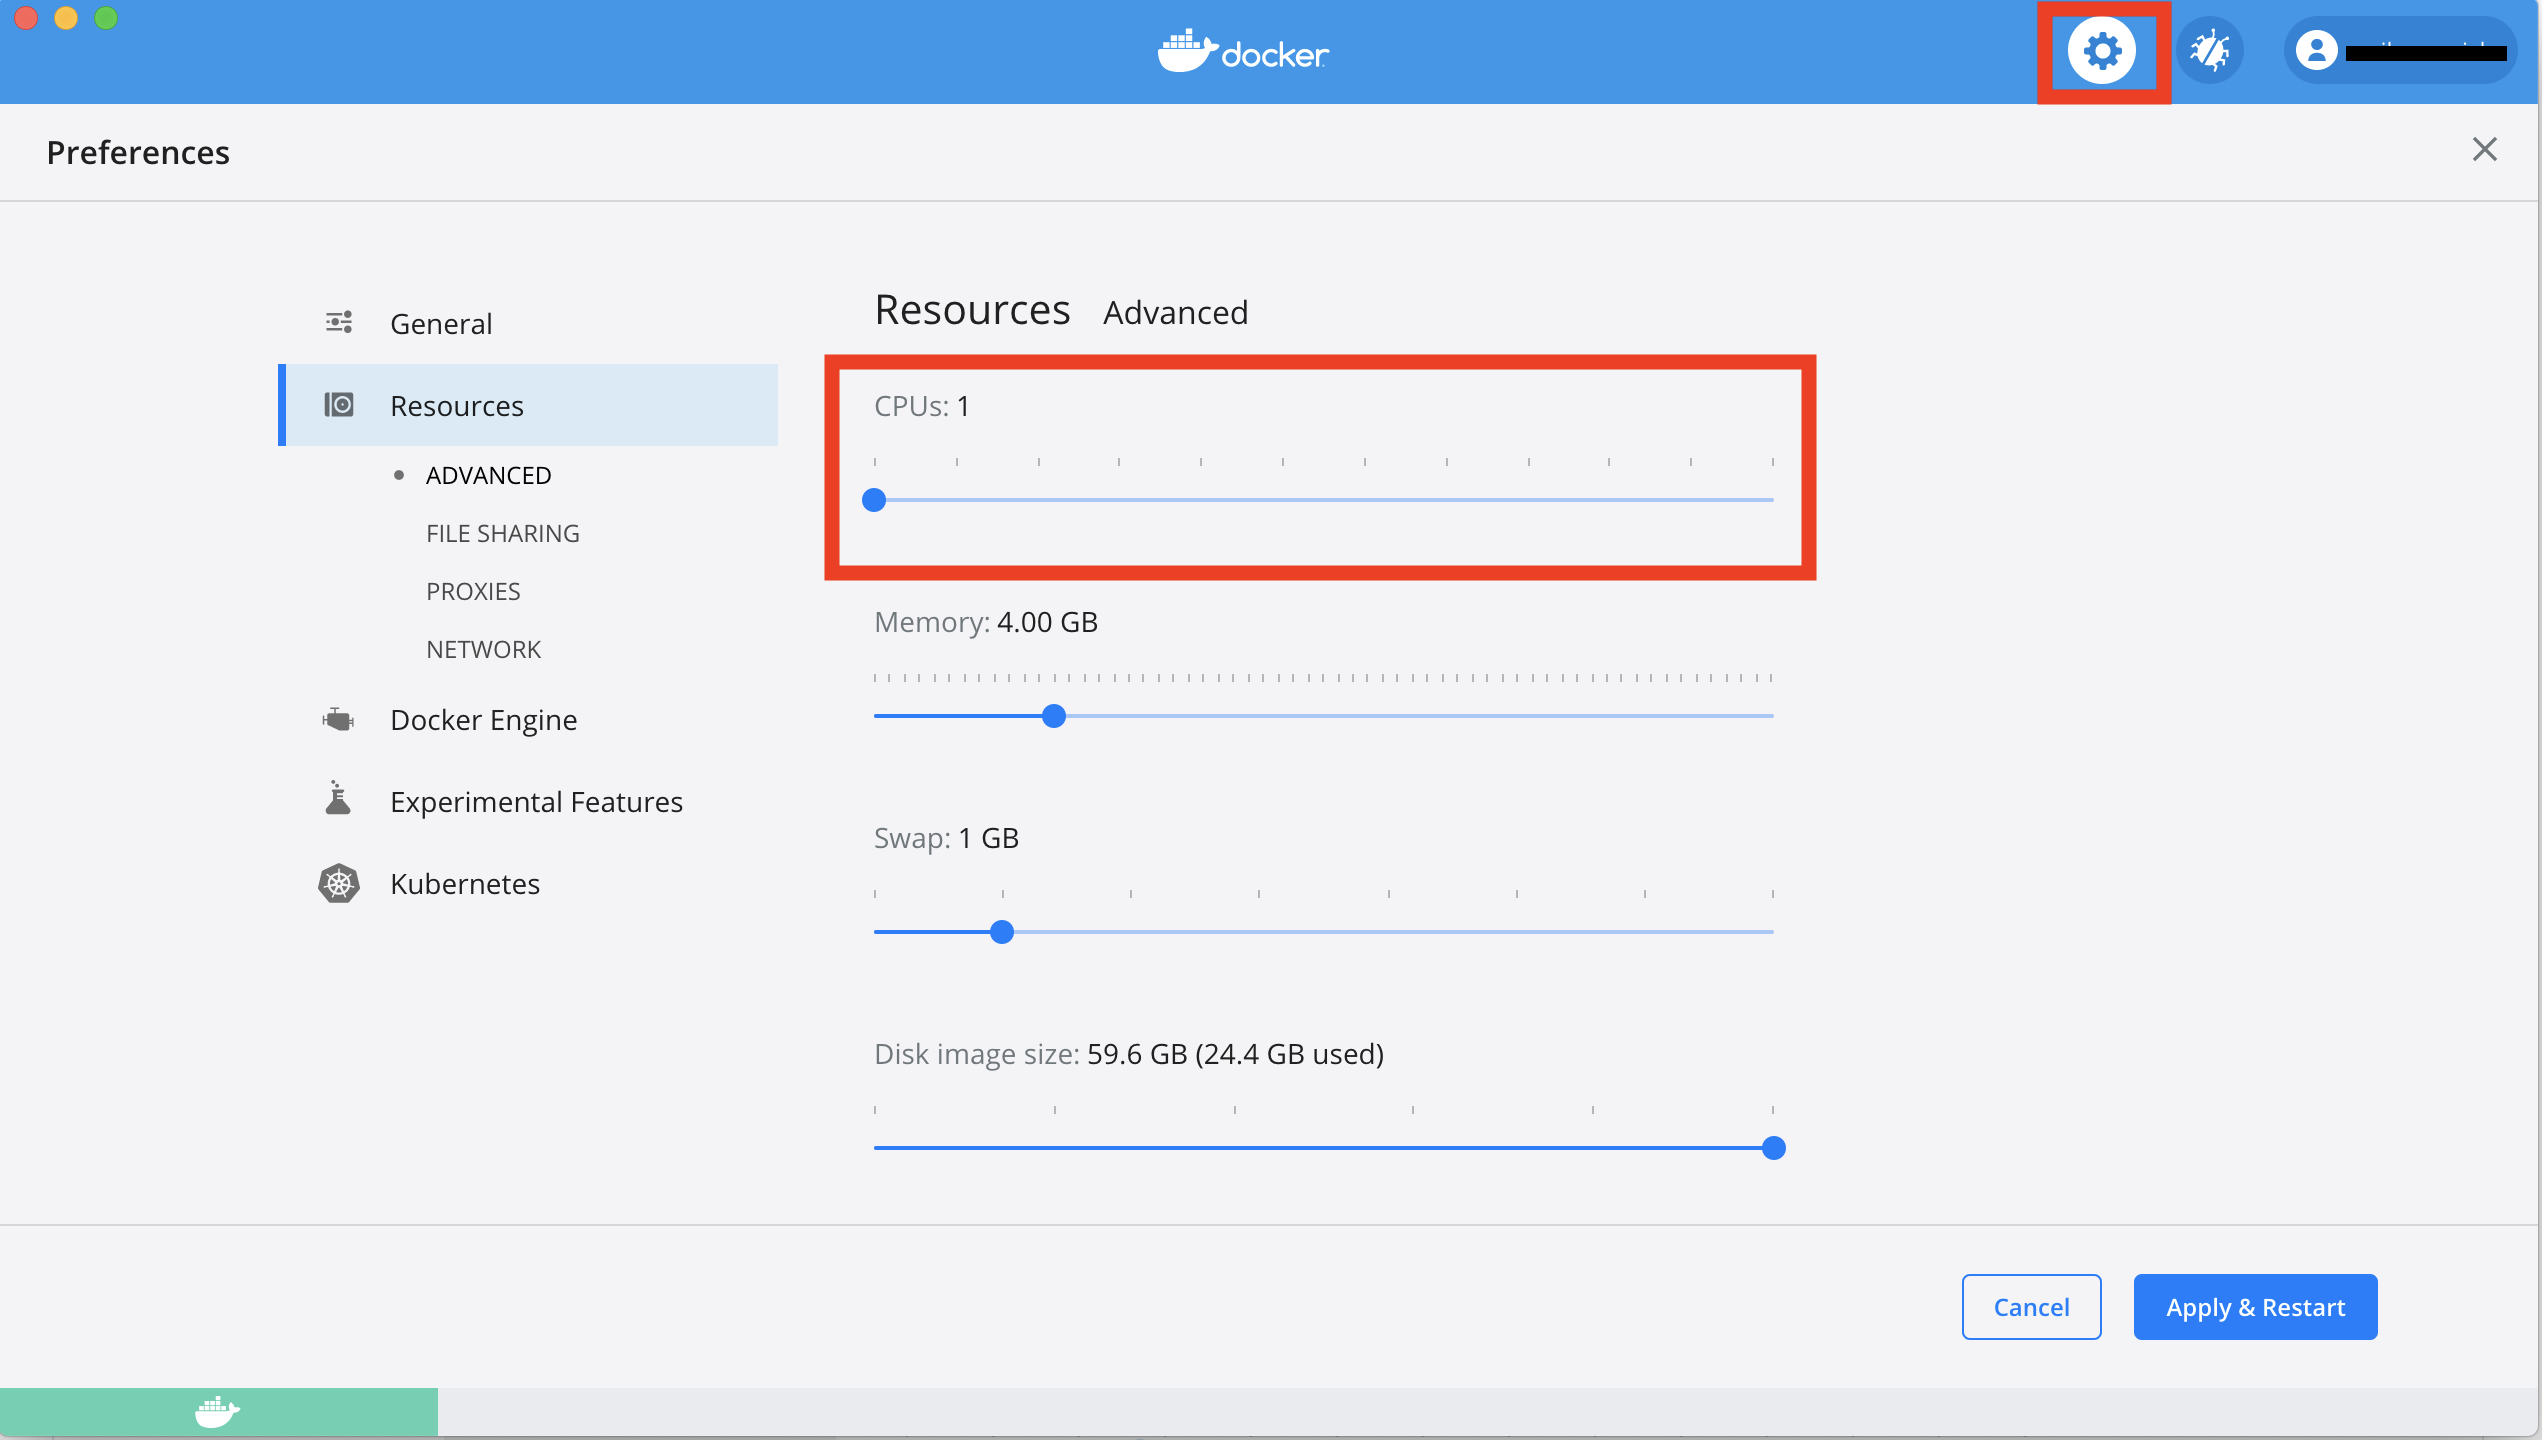
Click Apply and wait for Docker to restart. # Step 1: Preparing Your Input File
The input file must be a CSV file with a column called
address containing an address string. Other columns may be
present and will be returned in the output file, but should be kept to a
minimum to reduce file size.
An example input CSV file (called my_address_file.csv)
might look like:
| id | address |
|---|---|
| 13100070229 | 1922 CATALINA AV CINCINNATI OH 45237 |
| 54000600136 | 5358 LILIBET CT DELHI TOWNSHIP OH 45238 |
| 11200020024 | 630 GREENWOOD AV CINCINNATI OH 45229 |
Refer to the DeGAUSS geocoding wiki for more information about the input file and address string formatting.
Step 2: Geocoding and Deprivation Index
Open a shell (i.e., terminal on Mac or CMD on Windows). We will use this shell for the rest of the steps in this example.
Navigate to the directory where the CSV file to be geocoded is located. See here for help on navigating a filesystem using the command line.
For those unfamiliar with the command line, the simplest approach
might be to put the file to be geocoded on the desktop and then navigate
to your desktop folder after starting the Docker Quickstart Terminal
with cd Desktop.
Example call:
docker run --rm=TRUE -v "$PWD":/tmp degauss/cchmc_batch_geocoder my_address_file.csvReplace my_address_file.csv with the name of the CSV
file to be geocoded and run the call in the shell.
Note for Windows Users:
In this and all following docker calls in this example, replace"$PWD"with"%cd%". Refer to the DeGAUSS Windows Troubleshooting page for more information.
The output file is written to the same directory and
in our example, will be called
my_address_file_geocoded.csv.
Example output:
| id | address | bad_address | PO | lat | lon | score | precision | precise_geocode | fips_tract_id | fraction_assisted_income | fraction_high_school_edu | median_income | fraction_no_health_ins | fraction_poverty | fraction_vacant_housing | dep_index |
|---|---|---|---|---|---|---|---|---|---|---|---|---|---|---|---|---|
| 13100070229 | 1922 CATALINA AV CINCINNATI OH 45237 | FALSE | FALSE | 39.17112 | -84.46176 | 0.922 | range | TRUE | 39061006300 | 0.1527697 | 0.8884202 | 38470 | 0.1102819 | 0.1423795 | 0.1245533 | 0.3831315 |
| 54000600136 | 5358 LILIBET CT DELHI TOWNSHIP OH 45238 | FALSE | FALSE | 39.11552 | -84.61902 | 0.754 | range | TRUE | 39061021303 | 0.0372340 | 0.9339179 | 79750 | 0.0485043 | 0.0302770 | 0.0292599 | 0.2327838 |
| 11200020024 | 630 GREENWOOD AV CINCINNATI OH 45229 | FALSE | FALSE | 39.15321 | -84.49236 | 0.922 | range | TRUE | 39061006800 | 0.3780332 | 0.7611408 | 22854 | 0.1425873 | 0.3541076 | 0.3566146 | 0.5905153 |
Step 3: Roadways
Note: Prior to November 2019, this step involved running a different container called “Distance to Major Roadway”. The old version added one new geomarker column, but this version adds 4 new columns. The new column called “dist_to_1100” should be very similar to the “dist_to_major_road” column produced by the old version.
Example call:
docker run --rm=TRUE -v "$PWD":/tmp degauss/pepr_roadways:0.2 my_address_file_geocoded.csvReplace my_address_file_geocoded.csv with the name of
the geocoded CSV file created in Step 2 and run.
Note: This container could take longer than what users may be used to with other DeGAUSS containers due to the large size of the S1200 roadways shapefile. For example, using Docker to run this container for 193 geocoded addresses took 20-30 minutes on an HP laptop running Windows 10.
The output file is written to the same directory
and, in our example, will be called
my_address_file_geocoded_pepr_roads_300m_buffer.csv.
Example output:
| id | address | bad_address | PO | lat | lon | score | precision | precise_geocode | fips_tract_id | fraction_assisted_income | fraction_high_school_edu | median_income | fraction_no_health_ins | fraction_poverty | fraction_vacant_housing | dep_index | dist_to_1100 | dist_to_1200 | length_1100 | length_1200 |
|---|---|---|---|---|---|---|---|---|---|---|---|---|---|---|---|---|---|---|---|---|
| 13100070229 | 1922 CATALINA AV CINCINNATI OH 45237 | FALSE | FALSE | 39.17112 | -84.46176 | 0.922 | range | TRUE | 39061006300 | 0.1527697 | 0.8884202 | 38470 | 0.1102819 | 0.1423795 | 0.1245533 | 0.3831315 | 502.7043 | 534.7928 | 0 | 0 |
| 54000600136 | 5358 LILIBET CT DELHI TOWNSHIP OH 45238 | FALSE | FALSE | 39.11552 | -84.61902 | 0.754 | range | TRUE | 39061021303 | 0.0372340 | 0.9339179 | 79750 | 0.0485043 | 0.0302770 | 0.0292599 | 0.2327838 | 5793.1403 | 1654.7255 | 0 | 0 |
| 11200020024 | 630 GREENWOOD AV CINCINNATI OH 45229 | FALSE | FALSE | 39.15321 | -84.49236 | 0.922 | range | TRUE | 39061006800 | 0.3780332 | 0.7611408 | 22854 | 0.1425873 | 0.3541076 | 0.3566146 | 0.5905153 | 1453.0147 | 548.5412 | 0 | 0 |
Step 4: Drive Time and Distance to Care Center
Example call:
docker run --rm -v "$PWD":/tmp degauss/pepr_drivetime:0.6 my_address_file_geocoded_pepr_roads_300m_buffer.csv cchmcReplace
my_address_file_geocoded_pepr_roads_300m_buffer.csv with
the name of the CSV file created in Step 3, and replace
cchmc with the abbrevation for your care center from this
list:
| Name | Abbreviation |
|---|---|
| Children’s Hospital of Philadelphia | chop |
| Riley Hospital for Children, Indiana University | riley |
| Seattle Children’s Hospital | seattle |
| Children’s Mercy Hospital | mercy |
| Emory University | emory |
| Johns Hopkins University | jhu |
| Cleveland Clinic | cc |
| Levine Children’s | levine |
| St. Louis Children’s Hospital | stl |
| Oregon Health and Science University | ohsu |
| University of Michigan Health System | umich |
| Children’s Hospital of Alabama | al |
| Cincinnati Children’s Hospital Medical Center | cchmc |
| Nationwide Children’s Hospital | nat |
| University of California, Los Angeles | ucla |
| Boston Children’s Hospital | bch |
| Medical College of Wisconsin | mcw |
| St. Jude’s Children’s Hospital | stj |
| Martha Eliot Health Center | mehc |
| Ann & Lurie Children’s / Northwestern | nwu |
| Lurie Children’s Center in Northbrook | lccn |
| Lurie Children’s Center in Lincoln Park | lcclp |
| Lurie Children’s Center in Uptown | lccu |
| Dr. Lio’s and Dr. Aggarwal’s Clinics | lac |
| Recruited from Eczema Expo 2018 | expo |
The output file is written to the same directory and
in our example, will be called
my_address_file_geocoded_pepr_roads_300m_buffer_pepr_drivetime_cchmc.csv.
Example output:
| id | address | bad_address | PO | lat | lon | score | precision | precise_geocode | fips_tract_id | fraction_assisted_income | fraction_high_school_edu | median_income | fraction_no_health_ins | fraction_poverty | fraction_vacant_housing | dep_index | dist_to_1100 | dist_to_1200 | length_1100 | length_1200 | drive_time | distance |
|---|---|---|---|---|---|---|---|---|---|---|---|---|---|---|---|---|---|---|---|---|---|---|
| 13100070229 | 1922 CATALINA AV CINCINNATI OH 45237 | FALSE | FALSE | 39.17112 | -84.46176 | 0.922 | range | TRUE | 39061006300 | 0.1527697 | 0.8884202 | 38470 | 0.1102819 | 0.1423795 | 0.1245533 | 0.3831315 | 502.7043 | 534.7928 | 0 | 0 | 18 | 5004.925 |
| 54000600136 | 5358 LILIBET CT DELHI TOWNSHIP OH 45238 | FALSE | FALSE | 39.11552 | -84.61902 | 0.754 | range | TRUE | 39061021303 | 0.0372340 | 0.9339179 | 79750 | 0.0485043 | 0.0302770 | 0.0292599 | 0.2327838 | 5793.1403 | 1654.7255 | 0 | 0 | 24 | 10219.326 |
| 11200020024 | 630 GREENWOOD AV CINCINNATI OH 45229 | FALSE | FALSE | 39.15321 | -84.49236 | 0.922 | range | TRUE | 39061006800 | 0.3780332 | 0.7611408 | 22854 | 0.1425873 | 0.3541076 | 0.3566146 | 0.5905153 | 1453.0147 | 548.5412 | 0 | 0 | 6 | 1755.939 |
Step 5: Greenspace
Example call:
docker run --rm -v "$PWD":/tmp degauss/pepr_greenspace:0.1 my_address_file_geocoded_pepr_roads_300m_buffer_pepr_drivetime_cchmc.csvReplace
my_address_file_geocoded_pepr_roads_300m_buffer_pepr_drivetime_cchmc.csv
with the name of the CSV file created in Step 4 and run.
The output file is written to the same directory and
in our example, will be called
my_address_file_geocoded_pepr_roads_300m_buffer_pepr_drivetime_cchmc_pepr_greenspace.csv.
Example output:
| id | address | bad_address | PO | lat | lon | score | precision | precise_geocode | fips_tract_id | fraction_assisted_income | fraction_high_school_edu | median_income | fraction_no_health_ins | fraction_poverty | fraction_vacant_housing | dep_index | dist_to_1100 | dist_to_1200 | length_1100 | length_1200 | drive_time | distance | evi_500 | evi_1500 | evi_2500 |
|---|---|---|---|---|---|---|---|---|---|---|---|---|---|---|---|---|---|---|---|---|---|---|---|---|---|
| 13100070229 | 1922 CATALINA AV CINCINNATI OH 45237 | FALSE | FALSE | 39.17112 | -84.46176 | 0.922 | range | TRUE | 39061006300 | 0.1527697 | 0.8884202 | 38470 | 0.1102819 | 0.1423795 | 0.1245533 | 0.3831315 | 502.7043 | 534.7928 | 0 | 0 | 18 | 5004.925 | 0.3356100 | 0.3556324 | 0.3863916 |
| 54000600136 | 5358 LILIBET CT DELHI TOWNSHIP OH 45238 | FALSE | FALSE | 39.11552 | -84.61902 | 0.754 | range | TRUE | 39061021303 | 0.0372340 | 0.9339179 | 79750 | 0.0485043 | 0.0302770 | 0.0292599 | 0.2327838 | 5793.1403 | 1654.7255 | 0 | 0 | 24 | 10219.326 | 0.4182615 | 0.4350124 | 0.4295556 |
| 11200020024 | 630 GREENWOOD AV CINCINNATI OH 45229 | FALSE | FALSE | 39.15321 | -84.49236 | 0.922 | range | TRUE | 39061006800 | 0.3780332 | 0.7611408 | 22854 | 0.1425873 | 0.3541076 | 0.3566146 | 0.5905153 | 1453.0147 | 548.5412 | 0 | 0 | 6 | 1755.939 | 0.4157077 | 0.4082887 | 0.3774101 |
Step 6: Crime
Example call:
docker run --rm -v "$PWD":/tmp degauss/pepr_crime:0.1 my_address_file_geocoded_pepr_roads_300m_buffer_pepr_drivetime_cchmc_pepr_greenspace.csvReplace
my_address_file_geocoded_pepr_roads_300m_buffer_pepr_drivetime_cchmc_pepr_greenspace.csv
with the name of the CSV file created in Step 5 and run.
The output file is written to the same directory and
in our example, will be called
my_address_file_geocoded_pepr_roads_300m_buffer_pepr_drivetime_cchmc_pepr_greenspace_pepr_crime.csv.
Example output:
| id | address | bad_address | PO | lat | lon | score | precision | precise_geocode | fips_tract_id | fraction_assisted_income | fraction_high_school_edu | median_income | fraction_no_health_ins | fraction_poverty | fraction_vacant_housing | dep_index | dist_to_1100 | dist_to_1200 | length_1100 | length_1200 | drive_time | distance | evi_500 | evi_1500 | evi_2500 | fips_block_group_id | total_crime | personal_crime | murder | rape | robbery | assault | property_crime | burglary | larceny | motor_vehicle_theft |
|---|---|---|---|---|---|---|---|---|---|---|---|---|---|---|---|---|---|---|---|---|---|---|---|---|---|---|---|---|---|---|---|---|---|---|---|---|
| 13100070229 | 1922 CATALINA AV CINCINNATI OH 45237 | FALSE | FALSE | 39.17112 | -84.46176 | 0.922 | range | TRUE | 39061006300 | 0.1527697 | 0.8884202 | 38470 | 0.1102819 | 0.1423795 | 0.1245533 | 0.3831315 | 502.7043 | 534.7928 | 0 | 0 | 18 | 5004.925 | 0.3356100 | 0.3556324 | 0.3863916 | 390610063004 | 233 | 221 | 417 | 195 | 414 | 137 | 234 | 307 | 219 | 197 |
| 54000600136 | 5358 LILIBET CT DELHI TOWNSHIP OH 45238 | FALSE | FALSE | 39.11552 | -84.61902 | 0.754 | range | TRUE | 39061021303 | 0.0372340 | 0.9339179 | 79750 | 0.0485043 | 0.0302770 | 0.0292599 | 0.2327838 | 5793.1403 | 1654.7255 | 0 | 0 | 24 | 10219.326 | 0.4182615 | 0.4350124 | 0.4295556 | 390610213032 | 25 | 10 | 3 | 59 | 3 | 5 | 27 | 40 | 27 | 5 |
| 11200020024 | 630 GREENWOOD AV CINCINNATI OH 45229 | FALSE | FALSE | 39.15321 | -84.49236 | 0.922 | range | TRUE | 39061006800 | 0.3780332 | 0.7611408 | 22854 | 0.1425873 | 0.3541076 | 0.3566146 | 0.5905153 | 1453.0147 | 548.5412 | 0 | 0 | 6 | 1755.939 | 0.4157077 | 0.4082887 | 0.3774101 | 390610068003 | 230 | 312 | 645 | 116 | 611 | 205 | 218 | 333 | 192 | 172 |
Step 7: Removing PHI
Before sharing your data, remove the following columns:
addresslatlonfips_tract_idfips_block_group_id